%20(1024%20%C3%97%20500%20px)%20(13).png)
Is it AI or data or just plain voodoo? This question comes up time and time again, so we decided to give you a user-friendly answer. Which means not a super complicated, techy answer.
If you’re a CharityEngine client, you already know one of our claims to fame is the incredible amount of donor data you can collect with our natively built system. No matter how a nonprofit interacts with a donor, it’s tracked in your CRM. And all that data is in one place, making it a powerful tool for you.
And yes, we offer some pretty incredible reporting and analytics, so there’s a lot you can learn from that data. But one of the coolest things is giving probability.
In this article, we will explain how giving probability is calculated and how to interpret what you see in the donor records. We will also share how this information can amp up your fundraising in a big way!
Giving Temperature
When you open a contact record, look in the upper right-hand corner for the thermometer icon. In an instant, you can see the status of this donor.

This graphic offers you a quick glance at analytics on the probability of a supporter donating. It’s based on the extensive data collected in your CRM.
How, and how often, is a donor interacting with your nonprofit? Did they respond to an email, volunteer for an event, engage in a P2P campaign, or donate? If we’re tracking every interaction, then every interaction goes into the temperature score.
Consumer metrics that indicate engagement and commitment to your cause will guide a course of action. When you use a CRM that records detailed donor behavior, you’re ahead of the game. When you have a CRM like CharityEngine, all that data is in one place, and you get insights from this 360-degree view.
Based on the metrics, there are three action categories the donor can fall into:
- Nurture, which means it’s not the right time to ask for a donation. Whether they recently donated or not, they should be entered into a stewardship sequence, which is easy in your CRM!
- Warm refers to donors who are moderately engaged. They’ve supported you through past donations or have performed an action that serves as advocacy, or publicity, for your nonprofit. It’s approaching the right time to ask these donors for a gift.
- Hot donors are those who are actively and directly engaging with your nonprofit, whether it’s through consuming content or engaging in other actions that are building this score and moving their temperature to hot. These are the donors you’ll want to reach out to now.
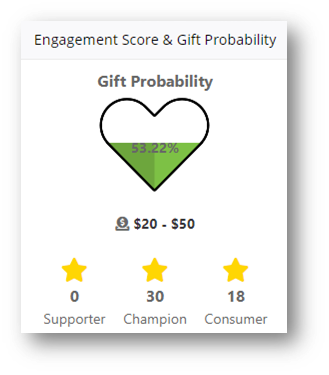
If you want to dive into more details about this donor and their giving habits and likelihood, click on the thermometer. You’ll see the Gift Probability graphic pop up.

This graphic tells you a comprehensive story about your donor! Let’s take a look at what you can learn.
Engagement Scores
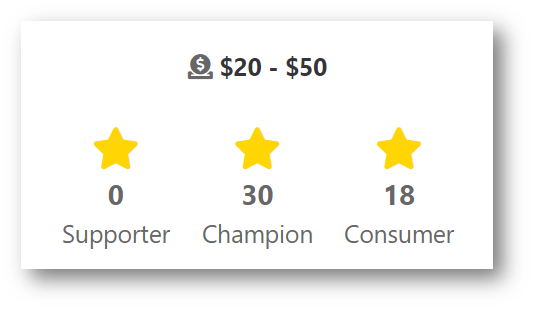
At the bottom of the graphic, you’ll see three stars with numbers. These represent engagement scores, or how often, and in what ways, the donor has engaged with your nonprofit.

The Supporter Score reflects recent giving. It evaluates the timing and size of gifts, such as one-time, recurring, memberships, or other gifts. The higher it is, the more, or the more frequently, the donor gave.
The Champion Score reflects advocacy engagement, attendance at an event, and ambassador-ship (soliciting gifts or peer-to-peer fundraising). It takes into account any activity that champions your cause.
The Consumer Score reflects online behavior. Does the donor visit your website? Do they engage with emails, opening them or clicking on the call to action? These donors are consuming content and trying to stay in the know. They are committed to your nonprofit and connected by more than just donations. Like the other engagement scores, these support the algorithms that define giving probability and give you insight into the behavior of each donor.
When taken together, these three scores give you a detailed view of donor engagement.
Recommended Gift Ask
Once all this data is mixed together and run through those powerful algorithms, the technology indicates a suggested gift ask.

If you ask this donor for $20 to $50, there’s a high likelihood you’ll be successful.
Giving Probability Score
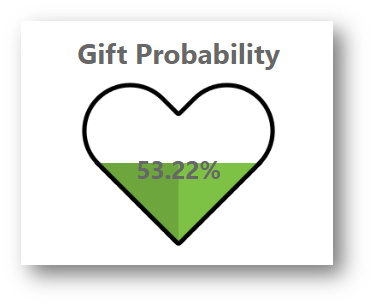
And finally, we look at the green heart in the middle of the graphic.

This score is calculated after analyzing the many data points discussed above, as well as others. CharityEngine tracks thousands of touchpoints and layers AI and big data algorithms to calibrate and optimize results.
The analysis of all those data points results in this percentage score. The higher the percentage – the more filled-in the heart – the higher the probability this donor is ready to make a gift.
CharityEngine is uniquely positioned to capitalize on all available data to offer Engagement Scores and Giving Probability, so you know when it’s time to act and how to approach your donor.
The Power of Data
As these giving indicators illustrate, the comprehensive and consolidated data collected by CharityEngine allows nonprofits to understand the nuances of each donor. Powerful reporting and analytics help you mine the data for insights, including personalizing your communications and outreach.
The result? CharityEngine clients can raise more money, engage donors more, and increase their global impact.
If you want more information on applying these robust capabilities to improve your fundraising, just contact Customer Success.

.png)
%20(1024%20%C3%97%20500%20px)%20(16).png)
.png)